Sign up for the Packaging Digest News & Insights newsletter.
December 12, 2017
6 Min Read

Selection of samples for testing. Image courtesy Nelson Laboratories
Brandon Muhlestein and Pal Khangaldy
A process for answering one of the most difficult questions in testing.
“How many packaging samples should I test?”
Every medical device and pharmaceutical manufacturer has asked this question at least once. It is traditionally one of the most difficult questions to answer since there is no clear guidance from either the standard test methods (ISO, AAMI, ASTM) or the regulatory bodies like FDA, HC, TGA, MHRA, etc. What is the reason? Some of the possibilities revolve around things like risk or liability; it could be that every product is different whether the difference is materials, packaging, sterilization, etc. It could also be economics associated with the cost of the part(s) and/or the manufacturing process. In most cases, determination of sample size is left for each company to decide and justify following a statistically valid rationale (reference ISO 11607-1, Section 4.3). 1 This elusive, yet crucial, question will be discussed as part of this article. This information can then be used as a starting point for sample size determination and justification.

Image of a tensile test courtesy Nelson Labs
Often, risk assessments, confidence and reliability intervals, and historical data are used to calculate sample size. The first step in selecting an adequate sample size is to calculate risk. Risk is the “combination of occurrence of harm and the severity of that harm that can occur due to failure.” A common approach to calculating risk is known as a Risk Priority Number (RPN). 2 The RPN is a calculation based on an assigned severity, occurrence, and detection value in which each category is assigned a value ranging from 1-10. For severity, a value of “10” would be the most severe. For occurrence, a value of “10” means the highest probability. For detection, a value of “10” means the most difficult to detect. An important thing to keep in mind is that RPN is not a measurement of the manufacturer’s risk; rather it is an assignment of risk priority. To understand this concept better, refer to the definitions below of each category as outlined by FMEA-FMECA: 3
Severity (S) - Severity is a numerical subjective estimate of how severe the customer or end user will perceive the effect of a failure.
Occurrence (O) - sometimes termed likelihood or probability, occurrence is a numerical subjective estimate that the cause of a failure mode will occur during the design life, or during production.
Detection (D) - It is a numerical subjective estimate of the effectiveness of the controls to prevent or detect the cause or failure mode before the failure reaches the customer. The assumption is that the cause has occurred.
The RPN is then calculated by taking the assigned number from each category and multiplying them together. On the high end, a final score of 1000 (when a score of 10 is given to each category) means a failure can be catastrophic to the end user. On the other side of the spectrum, a score of 1 means a very low impact to the end user if a failure were to occur.
For example, a product that has a high severity level (e.g., a failure could be catastrophic), a rating of 10 can be issued, which is worst case. The same product may have a high detection rating (where a failure is difficult to spot) so a value of 8 is assigned. Finally, it is assumed that a failure is rare and does not occur often. Therefore, an occurrence level of 4 is assigned. These values are then multiplied which results in an RPN of 320. Once the RPN has been calculated, it can be categorized using Table 1 in a three-tiered approach with low, medium, or high risk. 4
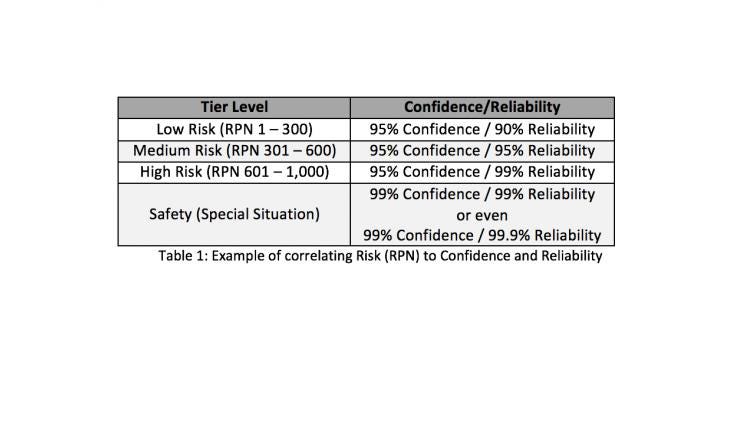
The RPN value has now been determined and can be correlated to sample size by using confidence and reliability intervals. Reliability determines how many units will successfully meet the pass/fail criteria. The Confidence Interval is an expression of uncertainty about an unknown constant. For example, a 90% reliability means that 90 out of 100 units will successfully meet all pass/fail criteria, and a 95% Confidence Interval, demonstrates that a manufacturer is 95% confident that they will have less than or equal to 10 true failures. Continuing with the example started above, (RPN of 320) we have established that a 95% Confidence / 95% Reliability level will determine the appropriate sample size for this risk level.
Entering the values into a Method 1 Non-parametric Binomial Reliability chart (see Table 2 below) along with the number of allowable test failures, the table will then provide the minimum sample size. It should be noted that non-parametric binomial reliability demonstration tests are used widely for tests that are attribute or qualitative data.
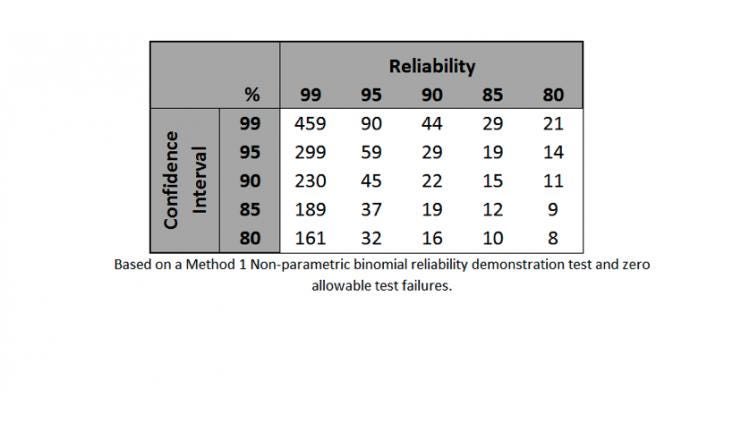
Table 2: lists the appropriate samples sizes for the given confidence intervals and reliability. The sample sizes listed in this table are for zero failures or errors.
In looking at the hypothetical example we discussed earlier in the article, an RPN of 320 and a confidence interval of 95% and a reliability of 95%, this translates to a sample size of 59 with zero allowable failures. When incorporating allowable test failures into the equation, the sample size required to achieve the same confidence and reliability intervals increases significantly.

Image of accelerated aging chambers courtesy Nelson Labs
Finally, manufacturers need to keep in mind that there are additional factors that can also affect sample size, like the cost of manufacturing the product and the complexity of design. It is highly recommended that manufacturers consult with packaging experts to help determine the pass/fail criteria and provide a sample size and justification for each of their products. This will help alleviate any issues during potential audits in this area. Selecting an appropriate sample size can be complex as there are no industry-accepted values that apply across the board. Different products pose different risks, therefore requiring different sample sizes. By understanding the technical aspects of the product, the manufacturing process, and the risk associated with its use, the first steps in determining and justifying a proper sample size can be taken.
References
1 - Packaging for terminally sterilized medical devices – Part 1: Requirements for materials, sterile barrier systems and packaging systems. ANSI/AAMI/ISO 11607-1:2006/(R) 2015
2 - http://www.ombuenterprises.com/LibraryPDFs/Understanding_Risk_Priority_Numbers.pdf
3 - http://www.fmea-fmeca.com/fmea-rpn.html
4 - http://www.innovativetechnologyconferences.com/files/Walfish_Steven.pdf
Brandon Muhlestein, CPLP-tech (ISTA), is a Consulting Study Director at Nelson Laboratories. Muhlestein sits on many ASTM committees and consults clients on testing within the packaging department, specializing in packaging validation.
Pal Khangaldy joined the Nelson Laboratories team as a Packaging Consulting Manager in 2017 bringing with him nearly 20 years of lab and consulting experience. Among other specialties, Khangaldy specializes in package performance and integrity testing of medical device, biomed, and pharmaceutical products.
You May Also Like