Latest
Apr 24, 2024
Apr 24, 2024
Apr 24, 2024
thumbnail
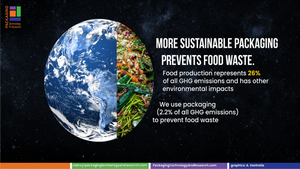
Food PackagingPackaging Can Work Harder to Prevent Food Waste
Packaging Can Work Harder to Prevent Food Waste
With Earth Day Stop Food Waste this week, we consider how brands and stakeholders can leverage packaging to reduce food waste.

Extended Producer Responsibility (EPR)
New Rules of Packaging Advance Circularity

The European Parliament debates new rules for packaging after experiencing significant increases in packaging waste.
Hot Right Now

Sign up for the Packaging Digest News & Insights newsletter.
Trends
Package Decorating Trends on Display

A powerful return of a certain printing technology is one of many reasons to make time to visit Labelexpo Americas this year.


Must Read
7 Reasons, and 5 Ways, to Use QR Codes on Your Packs

Expand your package’s communication bandwidth with these tips for getting the most out of using Quick Response codes.
Popular
From packaging design and materials, to automation and turnkey packaging lines, SouthPack is the largest regional packaging event for suppliers and buyers to discover innovation, engineer new technology, and build a better tomorrow. SouthPack is part of IME South, a six-in-one expo offering the latest insights & solutions spanning medtech, packaging, automation, plastics, design, & processing.
Register NowMore


Industry Voices