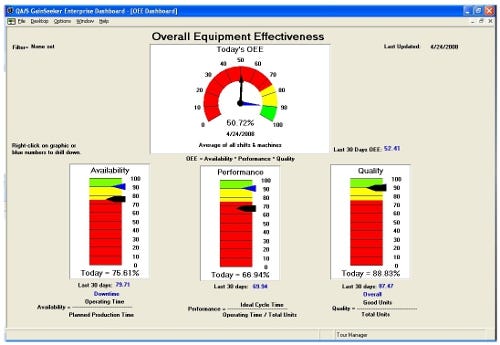
What should your OEE dashboard look like?
March 11, 2015
The holistic view which monitors, measures and assesses the total overall efficiency of a packaging line or lines is a growing industry trend. Overall Equipment Effectiveness (OEE) and Total Cost of Ownership measures are increasingly recognized by managers as best practice techniques to help them analyze and improve production efficiencies.
The common sense is undeniable. Like the cliché "a chain is only as strong as its weakest link" a single piece of equipment, performing poorly, will dramatically impact the output of the entire line. It's important to understand how all of the equipment, from hoppers and fillers at the beginning of a line, to wrappers and sealers, to labelers at the end, is performing and how their performance impacts the productivity of the entire line.
According to William Faulkner, president of Logopak Corp. USA, "While Logopak industrial print-and-apply labelers do their work at the end of a packing line, we understand the value of an OEE approach, including end-of-line labeling. We engineer all Logopak labelers with OEE in mind, including our operating systems, which are integration-friendly for OEE applications.
"While OEE can help identify and measure poorly performing equipment and production logjams, as well as equipment that may be under-utilized," continues Faulkner, "we've also learned that every business needs to develop its own approach to OEE, customizing a dashboard of metrics that best suit its circumstances and strategic business objectives."
What should your OEE dashboard look like? First, it's important to define the terms.
Fundamentally, OEE is based on monitoring measures of line equipment availability, performance and quality. Increasing line availability, performance and quality over time improves production and profitability. A total OEE of 85 percent (or better) is currently considered world class for individual packaging lines.
Availability takes into account any incident that results in machine down time. While plant holidays don't count, changeover times, swap out times, materials shortages and equipment breakdowns all result in downtime. Once measured, the ratio of actual operating time to estimated full production time provides a base metric for availability.
Performance measures the variables that may cause your equipment and overall line to perform below their maximum potential speed. Operator inefficiencies and errors, use of substandard materials, inadequate or inefficient equipment and process integration throughout the line, and equipment wear and tear may all result in a loss of speed and production capacity.
Quality measures losses that occur as a result of substandard output—that is, units of production that do not meet your Quality Control standards. Units that require rework should also be included in this measure.
OEE brings all three measures together in a single ratio to express the total impact of how much time your line is up and running, how quickly it is running, and the degree to which the line is producing good units.
Faulkner emphasizes that "every manufacturer has a unique situation that influences how these measures are modified and adapted to maximize specific production goals and business objectives."
Once your OEE dashboard is customized to suit your needs, pinpoint key areas of blockage and bottlenecks. Address issues one at a time, working through the most impactful issues first. This approach will quickly and efficiently improve your OEE. The key is: measure and repeat. Improving OEE is an ongoing process and part of your manufacturing culture, not a one-time event.
Source: Logopak Corp.

OEE dashboard 2
OEE Dashboard image courtesy of Hertzler Systems GainSeeker Suite.
.
About the Author(s)
You May Also Like


