Internet research aids decisions of packaging buyers
April 3, 2017

Nearly all packaging professionals use the internet to aid or facilitate some of their purchases, whether it be for finding appropriate suppliers or products, or for comparison shopping. Are they satisfied with their online experience?
Ongoing research in 2016 surveyed more than 450 people from 21 countries about their efforts to use the internet for a purchasing need during the past 12 months. Buyers shared their experiences about how they use the internet to facilitate a qualified purchase.
The research focused on 227 people who answered 20 different questions about their purchase. The results of the 2016 survey are compared to similar research carried out in 2015. Our long term goal is to perform the survey yearly, and build it out further around the world.
The main objective of the research is to enhance the online experiences of buyers while at the same time helping suppliers manage their multi-channel online marketing efforts. The full detailed report of our research can be downloaded for free below.
This year’s data was collected between mid-February 2016 and the end of June 2016. Survey participants were recruited by email, postings on trade association websites, postings in LinkedIn packaging groups and publicity postings by a few trade journals, such as this one.
We begin by describing the nature of the buys (demographics) and then proceed to discuss various online factors and measures.
Demographics
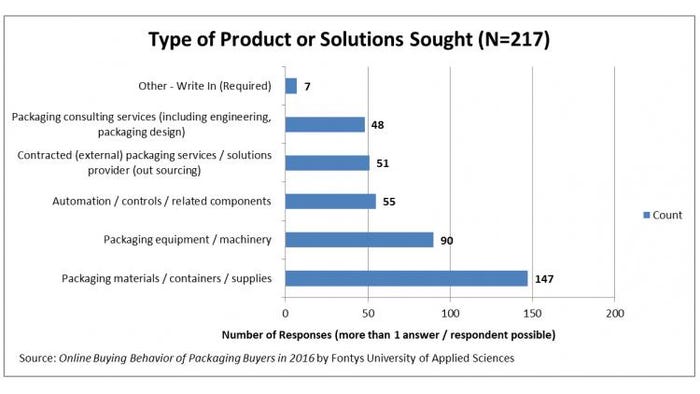
We asked what type of product or packaging solution the buyer sought. The types of needs are shown in Figure 1: Type of Product or Solutions Sought. Buyers were allowed to pick more than one response. While packaging materials (that is, frequently bought consumables) and supplies are the leading need, there were a healthy number of buyers seeking equipment, machinery, automation, components and services.
A large number (43%) of buyers bought something for the first time, or a product, service or solution they bought less than one time per year. This is an increase over 2015 when the percentage was 27%. The percentage increased by 16%, but we did not correlate exactly what people were buying for the first time or infrequently. It is possible that people were buying packaging materials for less than $1,000 online, which is a lot less risky than buying a more complex piece of equipment that costs $50,000.
The budgets for the purchases varied between less than $12K (thousand) and greater than $6M (million). Of the 157 people answering budgetary questions, a majority spent between $12K and $124K (52 buyers) or between $125K and $1.2M (38 buyers).
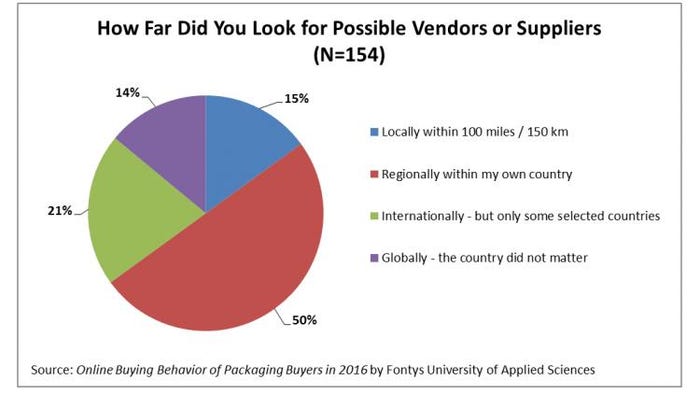
The distance searched from the buyer’s work location can also play a role in how the internet is used and perceived during the purchasing process. This year’s buyers predominantly searched within their own countries, but 36% looked internationally or worldwide, as shown in Figure 2: How Far Did You Look for Possible Vendors or Suppliers. The non-domestic searches were prevalent for purchases with budgets above $125K. Perhaps people searched internationally for higher priced items or services hoping to save money, get better products or services, or both.
The length of the buying process, including the online activities, averaged 3.9 months with a standard deviation of 3.5 months. A majority of the buyers (74%) completed their purchase in four months or less, but 11% reported they needed six to 24 months. Additional demographics can be found in the full report.
Internet usage during the buying process
To facilitate benchmarking, search for trends and help guide vendors about their efforts to service and support customer journeys, we again asked in which of four stages of the buying process the internet was used. In Figure 3: Internet Usage vs. Buying Stage, most of the buyers use online resources during the first two steps of the process. But still 52% of the 201 buyers use the internet to validate suppliers or solutions, creating a short-list of vendors.
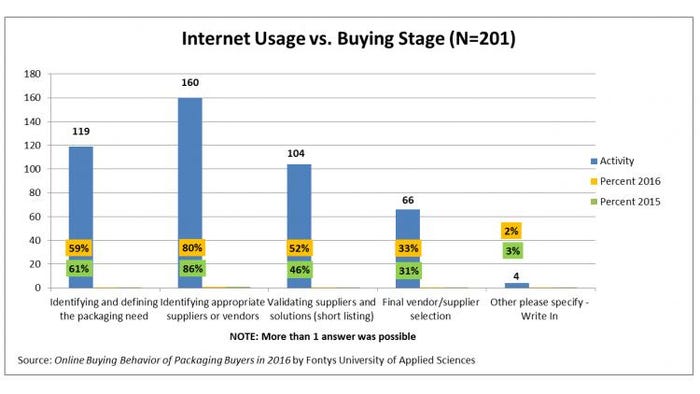
The only significant change between this year and 2015 appears to be that there are increases in the use the internet in the identification and validation stages.
Additionally, we asked about the utility of a variety of information sources or types of online or offline content used to support the buying process. These sources and content were again mapped against the four stages of the buying process, and there was a possibility to answer that the source or content was not used.
The different sources and content are shown in Figure 4: Utility of Information Sources vs. Buying Stages sorted in increasing order by the ones not used. For identifying appropriate suppliers and vendors, web searches, supplier websites, emails from suppliers, and relying on friends or colleagues are most often used (all above 30%). Social media, with the exception of LinkedIn, is hardly used during any of the buying stages, with less than 20% of the buyers using these channels.
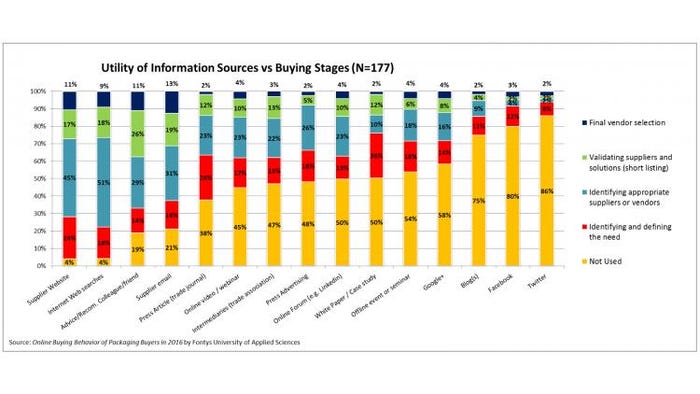
We compared this year’s results to those of 2015. The sample size in 2016 was 33% larger (177 versus 133), thus it might be more representative. In 2016, the use of press articles in trade journals, trade associations, online communities, blogs and offline events all declined by 10% in usage across the four different buying stages. Other big changes were a decline of 10% of the use of online forums or communities to validate and short-list vendors, and a decline of 9% of using trade associations or industry intermediaries to identify appropriate suppliers or vendors. Other changes are in the full report.
Besides looking at where buyers searched for information online, we asked specifically about what types of information they sought online, such as pricing, case study, best practice article or video. There were nine choices, plus none and a write-in option. Buyers could answer with more than one answer.
Besides product/services information (89%) and pricing (72%), the top categories included: industry/competitive comparisons (57%); technology primers/how-to documents (42%), and customer testimonial/case study (32%). The biggest changes compared to 2015 were a gain of 23% in people searching for technology primers, and a decline of the search for peer reviews or opinions (-17%). While these numbers are meaningful, they need to be interpreted with caution as the data sample is limited (176 for year 2016), and meaningful trends will probably not be possible to ascertain until we complete our 2017 survey.
Effort, Impact, Intent and Reputation
For each of the types of information that buyers searched for, we asked them to rate their perception of the information they found online using four factors: 1. Effort needed to find it (low / high); 2. The impact delivered (none / lots); 3. The intent as presented by the information (vague unclear / supportive of me); and 4. Reputation of the content (misleading-doubtful / impressive-certain).
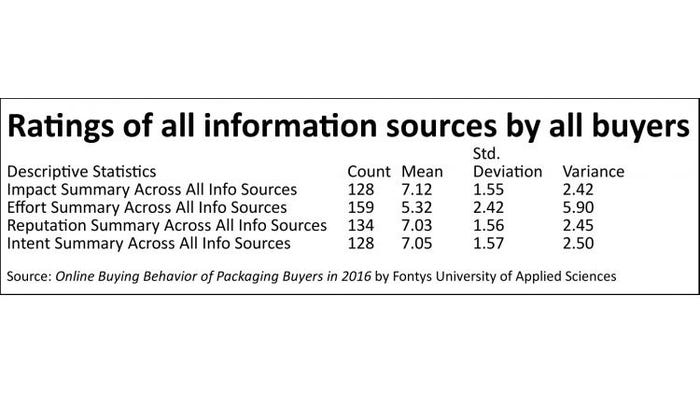
Table 1: Ratings of all information sources by all buyers shows the ratings of all information sources used by all types of buyers. The means are all above 7.0, with reasonable standard deviations, except for the effort it takes to find or access the information. Since effort is rated inversely to the other factors, it should rate at 3.0 or lower to be equivalent. We also note the larger standard deviation and variance for the effort ratings.
We focused in on the effort ratings, and some specific ratings of pricing information found online. The effort ratings were mapped against six different buyer roles as shown in Figure 5: Effort to Collect Info vs. Buyer Role. For the four main buyer roles—Influencer, Decider, Initiator and Buyer—there were 63, 37, 22, and 19 responses respectively.
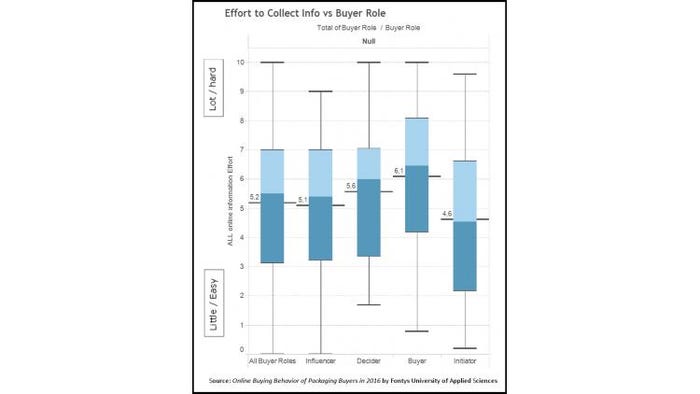
The effort to get pricing information was even higher than the mean for all types of information combined. Buyers reported a mean of 6.5, with an inter-quartile range of about 5.0 to 8.5. The pricing’s intent was quite transparent, with a positive rating of 7.1 mean, but of course there were several responses below 6.0 as well.
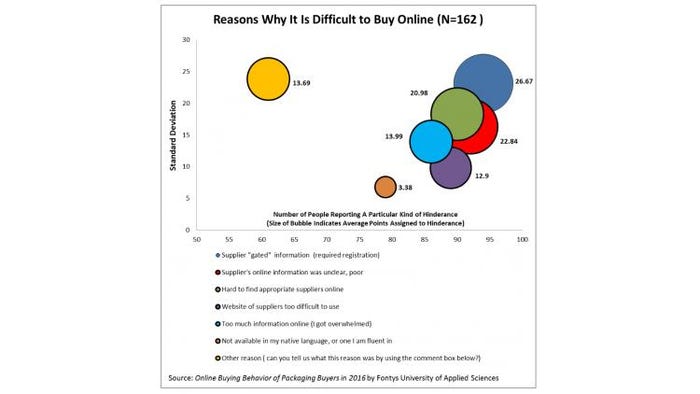
We went further and asked buyers to rank seven suggested reasons why they found it difficult to find their information online. The ranking used a forced scale of dividing 100 points amongst the options. The reasons are shown in Figure 6: Reasons Why It Is Difficult to Buy Online, mapped by the number of participants, versus the mean number of points given to a reason, versus the stand deviation of each reason. The highest rated hindrance was gated information reported by over 95 people, who assigned an average of 26 points to this issue, but we also note that this reason had the highest standard deviation. Close second and third reasons were unclear/poor information online, and simply difficult to find appropriate suppliers online.
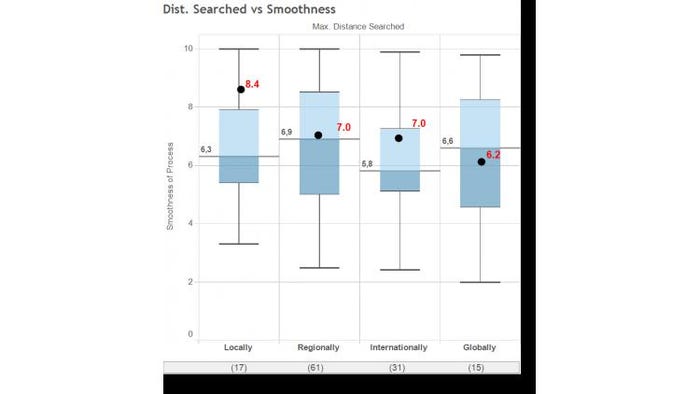
Lastly, we asked buyers to rate the smoothness of the entire buying process in which the internet was used as a tool to facilitate the process. The average rating was 6.5 with a standard deviation of 2.0, which is almost the same as in 2015 (6.8 and 2.0 respectively). A little more than 33% of the buyers rated the experience with less than 6.0, so there is room for improvement. The most challenging searches are for new or infrequently sourced products or services, which are searched for internationally. The mean values for this year’s smoothness results are shown in Figure 7: Dist. Searched vs. Smoothness, with last year’s values shown in red figures.
Conclusions
Using the internet to facilitate packaging solutions purchases is virtually unavoidable and used almost universally, as demonstrated by our research. However, the online journey is still far from optimal. We hope that the insights presented here and future work in this area will help buyers and suppliers narrow the gaps in expectations and services provided online.
We did not present any results pertaining to social media usage for buying purposes in this year’s reporting. We conducted another study recently about social media influencers in the packaging industries. The buying behavior data will be incorporated into that future report.
We invite all interested buyers to partake in our next survey in spring 2017.

George Szanto is a tenured lecturer specialized in business-to-business (B2B) emarketing at Fontys University in the Netherlands. His research activities focus on the online behavior of packaging professionals. Prior to this, he held various international executive management positions in tech industries for more than 20 years.
About the Author(s)
You May Also Like


