Packaging online buying shows small but significant shifts
June 28, 2018

The past four years, Fontys University of Applied Sciences has studied the online buying behavior of qualified packaging buyers around the world. During this time, we conducted three surveys in partnership with Packaging Digest. The latest study results showed that “Challenges remain in online packaging procurement experience”.
To understand why, we looked back at the historical data to see how buyers’ behavior changed between 2015 and 2017 based on three focus areas:
1. Demographics and characteristics of the buyers;
2. The actual online packaging buying process;
3. The use of online tools and channels.
What we found were some notable shifts, including:
• An increase in using the internet at the early stages of identifying and defining the buyer’s need.
• A plummet in using social media to facilitate a purchase.
• A spike in using technology primers and how-to papers or video clips for research prior to buying.
• A stronger reliance on email communication, and supplier websites—which still disappoint.
Here are highlights of the analysis of the historical data collected in our three studies. For a thorough look at the data, download the PDF at the end of the article. Grad student and co-author of this article Christina Djambazca wrote her thesis on the full results.
1. Demographics and buyer characteristics
Buyers in these surveys were qualified on the basis that they used the internet to help purchase something packaging-related the past 12 months, and their expenditures were $25,000 or more during the past year.
We collected useful data on 153, 157 and 145 buyers respectively in the years 2015, 2016 and 2017. In total, 1,229 people started the surveys over the three year period, but many of them were disqualified or did not finish the survey. We checked the duplicity of respondents to help explain our results, and found that only 7% (86 people who started the survey out of the 1,229) of the surveys were taken by people with the same IP address as years before. A majority, 84%, of the responses came from the North America.
The most common items bought were either packaging supplies or machinery and automation equipment, as shown in Figure 1. Over these years, most buying teams consisted of two to five people, which was reported 55% to 62% of the time. Each year, we defined six same buyer team roles and asked buyers which role they assumed for the purchase.
In Figure 2, we see that Influencers and Deciders make up the biggest groups at about 36% and 20% respectively. There is little change in this demographic over the years. When asked how far the buyer searched for a solutions, International and Global searches were consistent over the three years, varying between 20% to 22% and 11% to 15% respectively. Regional and Local searches varied a little more, ranging between 43% to 50% and 14% to 24% respectively. Just more than 50% of the budgets during these years for the purchases was less than $125,000—while 8% to 15% of the buyers reported having budgets between $1.25M and $6M, or greater than $6M.
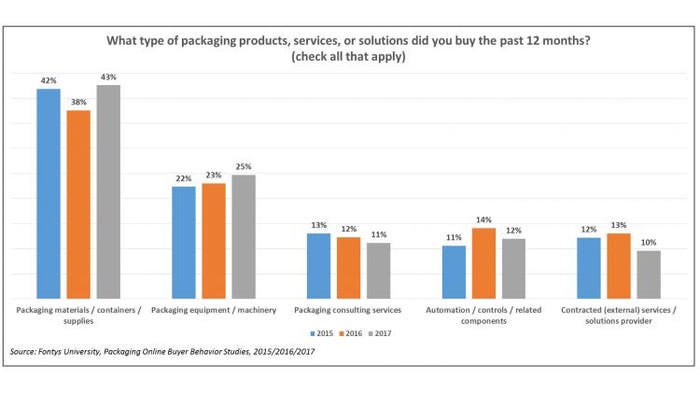
Figure 1: Most Common Types of Packaging Solutions or Materials Bought Using the Internet.
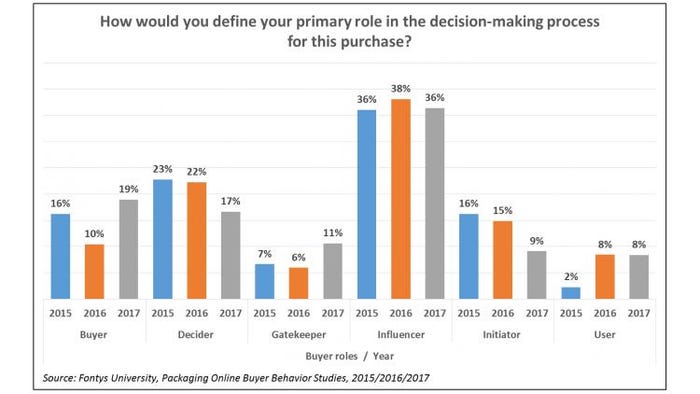
Figure 2: Division of Buyer Roles Over the Years.
2. How has the online buying process changed?
For our studies, we defined four buying stages for which the internet could be used to aid buyers. As shown in Figure 3, these start at defining or recognizing a need to finally selecting a vendor or supplier. Buyers indicate in which stage they used the internet for their purchase, with more than one answer possible.
It appears that in 2017, compared to previous years, buyers used the internet more during the first two stages—increasing usage by about 10% for identifying and defining the need, and increasing usage by about 7% to 10% for identifying appropriate vendors or suppliers. The latter two buying stages shown in Figure 3 are stable and almost the same for all three years.
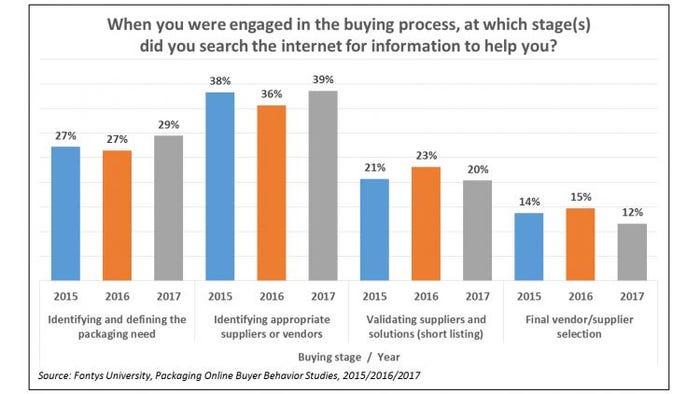
Figure 3: Internet Usage vs. Different Buying Stages.
The length of the purchase process has not really changed over the years. Figure 4 shows that 58% to 64% of the cycles last between one and five months for all years. While there are some differences for less than one month and six months to a year between the three studies, when analyzing the other demographic and process data, we could not identify any glowing factors that may explain the differences.
Each year, we ask buyers to rate the entire purchasing process on a scale of 1 to 10, with 1 being not smooth or difficult, and 10 being smooth or easy. Figure 5 shows that smoothness remains the same, with a small range between 6.5 and 6.8. While this score can be deemed as “ok,” there is room for improvement.
We reviewed these findings with packaging solutions suppliers/vendors. All of them indicated that they put significant effort into making the buyer online journey easier each year, or at least have strived to optimize it. Several of these vendors told us there is little more that they can do to further make their online content, process friendlier. They mentioned that, for some of their customers, the smoothness issue is internal to the customer’s corporate operations.
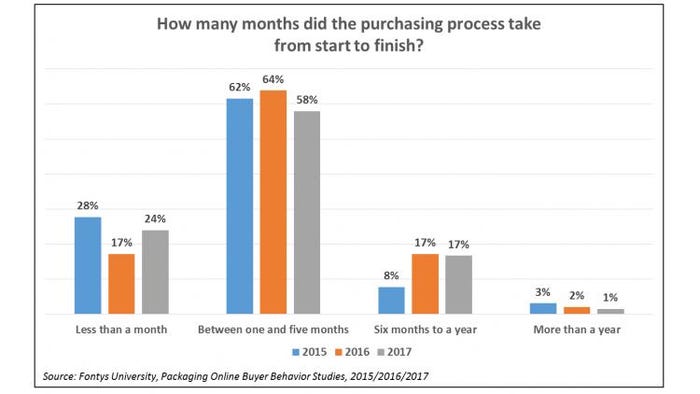
Figure 4: Lengths of Purchase Processes Reported By Buyer in Each Year.
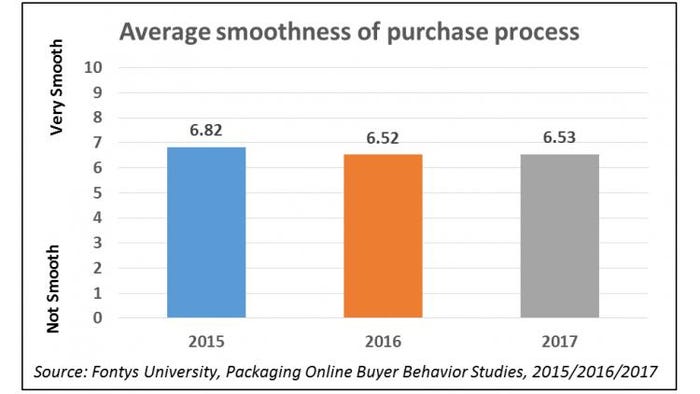
Figure 5: Average Smoothness of Entire Purchasing Process.
3. The use of online tools and channels
Every year, we present 14 different online sources of information or help that buyers can use during the four different buying stages defined above in Figure 3. We also present one choice for off-line information, such as trade shows or events. Here we present three of the most-used channels that remain quite consistent over the years and five channels that show decreasing usage in each of the three years.
First, we consider the three most commonly used online channels or tools for gathering information. Figure 6 shows that internet searches increased from 67% to 97% the past three years. We did not find a specific reason for this change. Email usage increased from 79% in 2015 to 86% in 2017. Lastly, between 95.9% to 98.3% of the buyers report using the supplier’s website to facilitate their purchase.
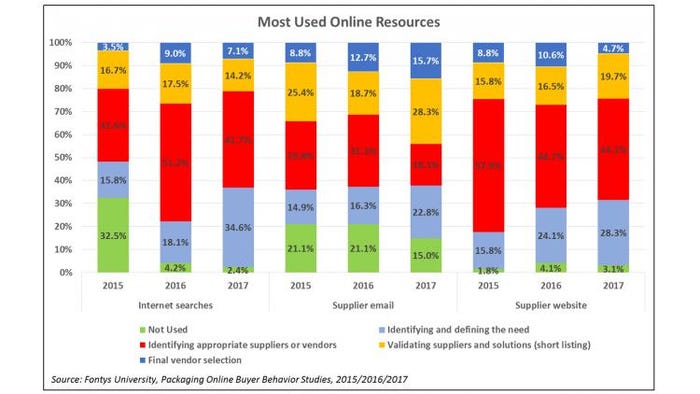
Figure 6: Top Three Most Commonly Used Online Channels the Past Three Years.
Now we present the data for the five channels or tools that are used the least.
Figure 7 shows that blogs are still useful for sometimes learning about special needs, new offerings or technology, and they lead to potential suppliers. However, the past two years, 75% of the buyers say they don’t read blogs to help their purchase.
Facebook is used even less with 80% of the buyers not using it the past two years. In the year 2015, it appears that many more people were using Facebook in their purchase cycles, but we did not investigate exactly what they were doing on Facebook to help their purchasing needs. Google+ still has some utility with 40% of the buyers using it in some way to aid their purchase. However, recent research reports claim that up to 91% of all Google+ accounts are empty. In addition we have doubts if Google+ is used a lot outside of the USA, as other researchers report that 55% of the users are from the USA.
For offline events, we see that usage decreased from 62% in 2015 to 39% in 2017. However, the 2015 numbers may have been somewhat influenced by our campaigns to recruit respondents at the Interpack trade show the year earlier.
Lastly, Twitter usage also declined from 57% to just 14% the past two years.
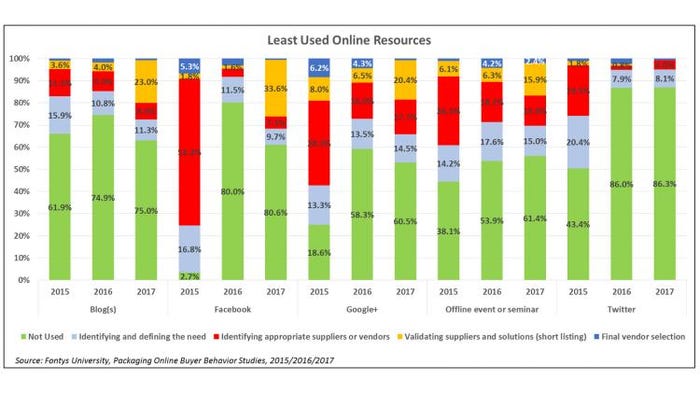
Figure 7: Five Least Used Online Channels or Tools the Past Three Years.
Each year, we present nine specific types of information that could be searched for online, ranging from product or service information to interviews with industry opinion leaders. The past two years, we saw an increase in people looking for product or service information and pricing. We see this in Figure 8, which also shows the average percentages for the three years combined. All other specific types of information are searched for the same amount except technology primers and how-to papers or video clips, which increased from 14% to 32% the past three years.
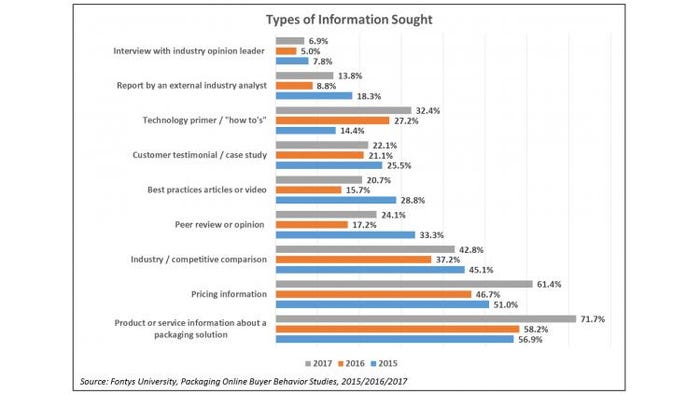
Figure 8: Types of Information Sought Online Line (more than one answer was possible).
Conclusions
In general, trends in the purchasing process show that, the buyer’s characteristics and their journey has not changed much in the last three years. To explain, packaging buyers still use the same amount of online information in each stage of the process and the total duration is consistently the same. In addition, the overall smoothness of the process has remained unchanged as well, steadily pointing at an average level of smoothness.
However, we do see shifts in the online tools and channels that packaging buyers use to aid their purchasing process. These trends do not show massive changes in the main tools and channels that are being used but rather show an increase in the intensity with which they are being used. The most favored channels and types of information increase even further in relevance and the least used ones diminish even further in significance for the buyers’ online buying process.
Overall, the findings indicate that small changes have occurred in the online buying behavior of packaging buyers in the last three years. The reason for that may be due to the low level of flexibility that is generally associated with business-to-business (B2B) purchasing decisions at large, multinational companies.
In addition, the complexity of the process alongside the size of the buying team may be linked to the reason why the purchasing process has not improved in terms of smoothness in the last three years.
And the efforts of suppliers to improve the quality and efficiency of the online buying process for their customers has not achieved its goal—or at least has not been noted by the buyers.

Co-author George Szanto is a tenured senior lecturer specialized in business-to-business (B2B) emarketing at Fontys University in the Netherlands. His research activities focus on the online behavior of packaging professionals. Prior to this, he held various international executive management positions in tech industries for more than 20 years.

Co-author Christina Djambazca is a recent graduate of Fontys University of Applied Sciences’ International Business and Management Studies Degree program. Her next career step is to pursue a Master of Science degree in Sustainable Finance at Maastricht University in the Netherlands.
About the Author(s)
You May Also Like


