March 11, 2015

Today’s factories generate incredible amounts of raw data that can offer insight into the production process from start to finish. PepsiAmericas is a company that is no stranger to the power of plant-floor information. The company recently embarked on a quest to gather critical production data from its beverage-making processes and present it in a format that would enable better decision making. The result is that PepsiAmericas has increased information access and gains a clearer picture of the plant floor, which it has used to improve manufacturing and business processes.
The PepsiAmericas facility in Des Moines, IA, is one of 19 U.S. beverage-production and bottling plants operated by PepsiCo, Inc. Nestled in the heart of central Iowa, the facility makes and packages more than 45 brands of Pepsi-Cola products and distributes them throughout the Midwest. In a single day, the plant produces nearly 60,000 cases of soft drinks, totaling more than 20 million cases annually. While the facility has a strong record of operating efficiency, it was experiencing unexplained interruptions on the canning line that were causing a chain reaction of bottlenecks in downstream processes. This resulted in large blocks of downtime, which began to drive up labor costs and prevented PepsiAmericas from meeting its high throughput goals. In an environment where an hour of downtime results in $300 in labor costs and $10,000 in lost product, several hours of idle production can result in tens of thousands of dollars in total losses. To keep up with the increasing industry pressures, reduce costs and optimize performance, PepsiAmericas realized it needed a clearer picture of what was happening on the plant floor from start to finish.
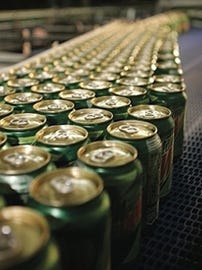
As is the case with most beverage processes, production begins in the raw-materials receiving area of the facility. A depalletizer breaks down 10-foot-tall pallets, stacked with 8,000 cans, layer by layer, and shuffles them onto an air conveyor. The cans move in a single-file line overhead, snaking their way toward the other end of the facility. Each can is sanitized as it passes through an ionizer and tumbles in roller-coaster fashion into the filler room.
In another part of the facility, the large batching tanks of the mass-mix system combine flavored syrup and carbonated water to make the soft drink. The sanitized cans reach the filler room and make their way through a 72-valve filler station, which operates at speeds of up to 1,200 cans/min. Here, each can is filled and charged with a shot of nitrogen, after which a series of rollers seal it with an aluminum lid. The cans leave the filler room upside-down and make their way back out into the warehouse, where they are warmed to prevent sweating that would destroy the paperboard packaging. Date and product information is then laser-printed on the bottoms of the cans.
From there, the cans move to the packaging area, where they are put into one of three package options—a six-pack bound by plastic rings, a rectangular 12-pack Fridge-Mate or a 24-pack cube. Finally, the 6-, 12- or 24-packs go to an automatic palletizing station for stacking, wrapping and preparation for distribution. The entire process, from unloading the cans to wrapping the pallets, takes less than 20 min.
PepsiAmericas was using manual paper- and pencil-based systems to collect performance data from the can line. Operators monitored the line’s production and recorded throughput and downtime events during each shift. This information was then manually plugged into the company’s enterprise-financial system, which logged how many flavors, cases and package sizes were made each day. Management also reviewed the data to identify shutdown incidents and attempts to troubleshoot the problems.
In addition to being unreliable and cumbersome, the process gave management little insight into what was really happening. While operators were meticulous in recording downtime incidents, they were only capturing the obvious issues–10- or 15-min-long events–that were easily recognized as problems. What they were not seeing were the short blocks of downtime, such as a few seconds here and a minute or two there that, over the course of a day, could add up to significant loss. In addition, merely noting the downtime episodes could not help management understand why they occurred, which left PepsiAmericas playing a never-ending guessing game of how to improve can-line operations. “With the old system, we were relying on people to collect and record the data, and then log it into our business system without flaw each day,” says Dave Bramow, production manager, PepsiAmericas. “This was a tedious, error-prone process that, in the end, couldn’t give us the information we needed to correct the problems causing the downtime.”
PepsiAmericas knew that in order to eliminate the bottlenecks and stoppages, it needed an accurate picture of the canning process. This meant up-to-the-minute access to real-time information to help management capture the short intervals of downtime that were not accounted for. To do so, it needed a sophisticated data-acquisition system that could gather information from the entire line and present it to management in a usable format for better decision-making.
In the summer of 2004, PepsiAmericas enlisted a team of engineers to identify and implement the solution. The team, led by Bramow, sought an automation supplier with the industry expertise and technical capabilities to provide a solution that could turn plant-floor information into business knowledge. The solution needed to deliver accurate, real-time information to help management identify the root cause of problems and drive continuous-improvement initiatives. In addition, PepsiAmericas wanted a solution that could integrate its disparate systems together to improve supply-chain visibility and streamline production from start to finish.
After reviewing several proposals, PepsiAmericas chose Rockwell Automation (www.rockwellautomation.com) as its automation partner. “We’ve had a long relationship with Rockwell Automation and the majority of our applications are built on their control systems,” says Bramow. “Rockwell Automation listened to our problems and offered a solution that could be tailored to help us overcome our unique challenges. We also had peace of mind knowing that we had local support during and after the installation. We didn’t get that assurance from the other vendors.” Selected as the backbone for the beverage producer’s enterprise data acquisition was the Rockwell Automation® Line Performance Solution, a suite of pre-integrated software and services based on the Rockwell Software® FactoryTalk® production and performance software suite. The solution provides a deeper view into a production line’s operational processes by aggregating and contextualizing key performance data to help correlate the variables that impact overall equipment-effectiveness (OEE). The system provides operators and managers with on-demand access to downtime monitoring and alerts, production performance analytics and equipment operating metrics. Numerous reports display production metrics associated with time, shift, operator, work order and product.

With just a few mouse clicks, management can view OEE calculations by work-cell, downtime/machine, quality data, changeover times and the causes of stoppages.
“The Line Performance Solution offered everything we were looking for, in terms of functionality, robust data-gathering capabilities and ease of use,” says Bramow. “It was essential for improving our overall visibility, tracking and control of the line’s performance, so that we could maximize its capacity and ensure product quality. It also had the best format for communicating the information to those who use it, both at operator and supervisory levels.”
PepsiAmericas wanted to identify all interruptions of 10 different workcells to give management a clear picture of production without overwhelming them with information. More specifically, the team wanted data on the number of downtime incidences, the duration of each episode, and what caused the events in an easy-to-read format. The new system also needed to be able to generate throughput, waste and efficiency figures and have flexible reporting-options so management could break performance outputs down by the shift, operator, hour, minute or second. Finally, PepsiAmericas wanted to maximize its technology investments. With an installed base of nearly 95 percent Rockwell Automation control-system hardware and software, PepsiAmericas wanted to leverage its existing automation infrastructure for maximum impact and return-on-investment. “All of our systems were loosely tied together because our network was incomplete,” says Bramow. “We wanted to upgrade to a central data-highway to improve integration and information exchange throughout the facility.”
In addition to tying the facility’s disparate applications together, the team hoped this would help them leverage the information housed in the Rockwell Automation control systems, which was a mix of Allen-Bradley PLC-5 and SLC-500 controllers, to monitor efficiency and identify downtime. Nearing PepsiAmericas’ peak season, all of this, including installation, needed to be achieved in a short timeframe and with minimal impact on production.
The PepsiAmericas team also faced the challenge of making sure it could transport all of the data coming off of the Rockwell Automation controllers to the server. To do so, PepsiAmericas installed an EtherNet/IP network, which enables the Line Performance Solution to gather information housed in the controllers of each workcell and quickly send it back to the system’s central server. Once the network was installed, the solution integrated seamlessly into the facility’s existing architecture. In addition, the EtherNet/IP network enabled the team to connect each part of the process, from unloading the cans to palletizing, creating a more integrated production-system.
The team then configured FactoryTalk Metrics, which is a Microsoft® Windows®-based software application for evaluating the performance of critical production assets, on its production server. In addition, FactoryTalk Historian was installed to help collect, analyze and report production data through web-based reporting. FactoryTalk Integrator SE transaction-manager software acts as a transport mechanism, providing efficient data transfer between the controllers and the server. By working seamlessly with one another and the Rockwell Automation control systems, these software tools help extract manufacturing data, allowing PepsiAmericas to review current and historical performance-information.
Once PepsiAmericas determined a baseline for production and the solution was up and running, it began collecting, storing and analyzing production information. The Line Performance Solution started delivering a treasure trove of manufacturing data. This information is displayed in easy-to-read graphics and customized reports on a standard personal computer off the production floor. With a few mouse clicks, management is able to view general OEE calculations by work cell, downtime for each machine, quality data and changeover times, as well as specific events that cause line stoppages, such as a jammed can or spilled product. The obsolete paper-based system has been eliminated. “Access to this information has helped us understand production inefficiencies and work to remedy them,” says Bramow. “It’s really eliminated the guesswork and finger-pointing that used to be a part of improvement initiatives.”

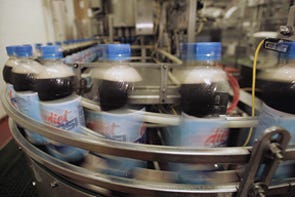
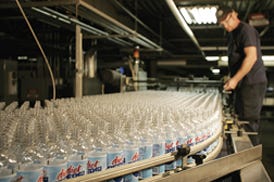
Production begins in the raw-materials receiving area of the facility, where a depalletizer breaks down 10-foot-tall pallets of empty cans and bottles, layer by layer, and shuttles them onto an air conveyor to be sent to the filler room.
PepsiAmericas also was experiencing mysterious blocks of downtime at the filler station and operators could not keep it running properly. By reviewing data from the Line Performance Solution, management realized that the layout of the filler’s control panel had many of the process switches close to one another. The sanitation-mode switch was right next to the one that shut the filler off. “Before the Line Performance Solution, we ran into instances where we couldn’t get the filler to run and we didn’t know why,” says Bramow. “After reviewing the data, we realized that operators were mistakenly turning the filler into sanitation mode, which resulted in several hours of downtime for each incidence.”
Since the installation of the Line Performance Solution, the team at PepsiAmericas has worked to turn plant-floor information into business intelligence to build a competitive advantage. By using information to identify line interruptions and improving operations through corrective actions, best practices and training, Bramow and his team have achieved a six-percent increase in efficiency, which equates to more than $120,000 in savings each year.
With the success of the Des Moines facility, other U.S. PepsiAmericas plants will soon be deploying Line Performance Solutions. This will help PepsiAmericas compare apples to apples, when analyzing production at all of its facilities. “We selected Rockwell Automation not to just be a short-term, one-project supplier, but to be a long-term partner,” says Bramow. “This solution has helped strengthen our competitiveness in the industry, and it has enabled us to take a more proactive approach to optimizing our operations.” The warehouse entrance at the Des Moines facility proudly bears a 10-ft-long banner for the 2005 PepsiAmericas Plant of the Year. The plant received the award for demonstrating efficiency and optimizing productivity in 2005, outshining its 18 sister facilities. “When all is said and done, our priority is to make quality beverages for our customers, and Rockwell Automation works to provide systems like the Line Performance Solution that help companies improve operations,” says Bramow. “By partnering and focusing on these objectives, we both succeeded.”
More information is available: |
Rockwell Automation, 414/382-2000. |
You May Also Like


