Proliferation of products and PET bottles characterize the shifting beverage market.
November 11, 2020

What’s going on in the beverage market? And what are the packaging trends?
A guy who knows is Tom R. Reimer, the director of education for the International Society of Beverage Technologists. Reimer provided a “Beverage Industry Overview” November 10 during the Pack Expo Connects virtual tradeshow. Here’s a selection of details from his informative presentation starting with overall market facts:
The organization tracks 13 categories of beverages, with packaged water being the largest segment at 39% followed by carbonated drinks at 31%.
In 2015, packaged water overtook carbonated soft drinks (CSDs) as the largest category.
It’s a shifting landscape, with CSDs and fruit juices declining in market share as energy drinks and functional water are on the rise.
Functional beverages include those that are protein enriched, women-focused, fortified, weight-loss, or cannabis enhanced (CBD and THC).
Processing methods include Flash or Tunnel Pasteurization, Hot fill, Retort, and High-Pressure Processing (HPP). You can find more information on the latter at Packaging Digest’s HPP channel.
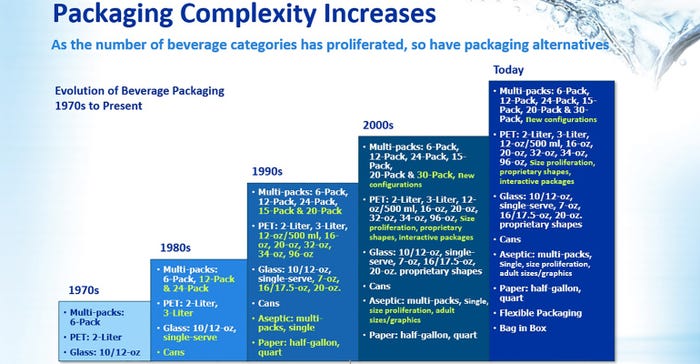
Now, onto our headliner topic of packaging which, according to Reimer, is “used to protect and draw attention to the product and has grown more complex over the years.”

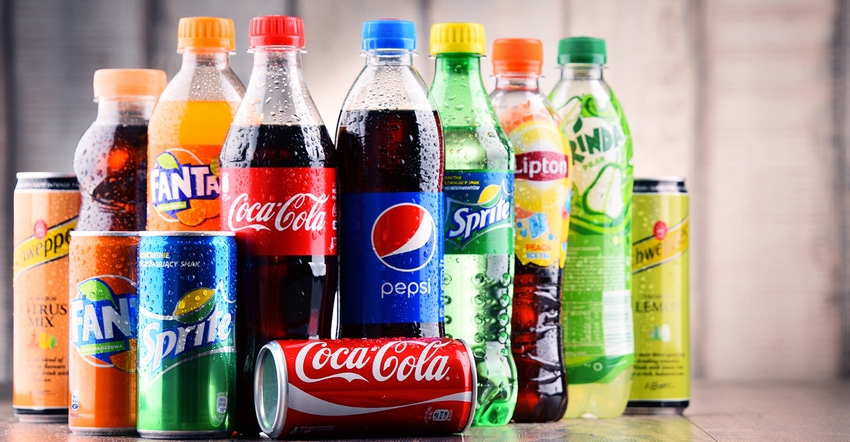
Beverage market product growth has led to a steady increase in the diversity of packaging formats.
PET packaging dominates beverages at 67% market share, far outdistancing all other materials.
While glass holds only a 7% share of market, he notes a recent “uptick in glass bottles.”
Glass is often used for premium positioned products and, I’d surmise, may be seeing a growth bump due to the plastics packaging backlash.
Here are a couple by-the-numbers factoids he shared:
81% of PET bottles market is for CSDs and water, with 30% and 51% respectively.
Glass is the biggest material loser in water, with share plummeting from 30% in 1998 to 5% currently.
48% of sports and energy drinks are in PET, with metal (aluminum in this market) bottles and cans at 41%.
65% of tea and coffee are in PET.
95% of dairy beverages are in high-density polyethylene.
Reimer noted an interesting tension regarding product shelf life: retailers want to have 50% of the shelf life under their control while consumers feel that long shelf life is a sign of excessive processing.
A trend that Reimer expects to continue: more variety and growth in new products, which means more stock-keeping units and packaging.
I’ll drink to that.
You can gain access to Reimer's presentation video here.
You May Also Like


