Study IDs the 14 million Americans who scanned QR or bar codes in June 2011
March 11, 2015

Mobile phone scanning
comScore Inc., a leader in measuring the digital world, has released results of a study on mobile QR and bar code scanning based on data from its comScore MobiLens service. A QR ("quick response") code is a specific matrix bar code (or two-dimensional code) that is readable by smartphones.
The study found that, in June 2011, 14 million mobile users in the U.S., representing 6.2 percent of the total mobile audience, scanned a QR or bar code on their mobile device. The study found that a mobile user that scanned a QR or bar code during the month was more likely to be male (60.5 percent of code scanning audience), skew toward ages 18-34 (53.4 percent) and have a household income of $100k or above (36.1 percent). The study also analyzed the source and location of QR or bar code scanning, finding that users are most likely to scan codes found in newspapers/magazines and on product packaging and do so while at home or in a store.
"QR codes demonstrate just one of the ways in which mobile marketing can effectively be integrated into existing media and marketing campaigns to help reach desired consumer segments," says Mark Donovan, comScore svp of mobile. "For marketers, understanding which consumer segments scan QR codes, the source and location of these scans, and the resulting information delivered, is crucial in developing and deploying campaigns that successfully utilize QR codes to further brand engagement."
Demographic profile of a QR code user
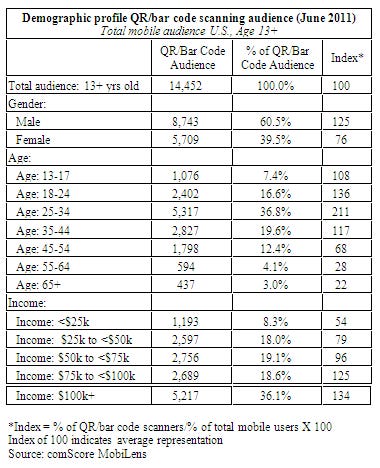
A demographic analysis of those who scanned a QR or bar code with their mobile phone in June revealed an audience that was more likely to be male, young to middle-age and upper income. Men were 25 percent more likely (index of 125) than the average mobile user to scan QR codes, representing 60.5 percent of the scanning audience.
More than half of all QR code scanners were between the ages of 18-34 (53.4 percent). Those between the age of 25-34, who accounted for 36.8 percent of QR code scanners, were twice as likely as the average mobile user to engage in this behavior, while 18-24 year olds were 36 percent more likely than average (index of 136) to scan. More than 1 of every 3 QR code scanners (36.1 percent) had a household income of at least $100,000, representing both the largest and most over-represented income segment among the scanning audience.

comScore Chart 1
Source and location of QR code scanned
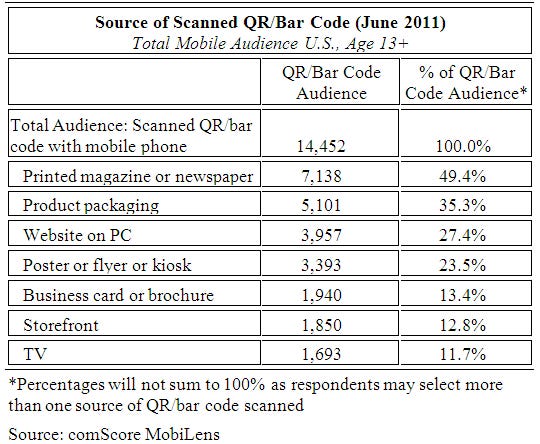
Analysis of the source and location of QR or bar code scanning revealed further insights into how consumers are interacting with this marketing tool. The most popular source of a scanned QR code was a printed magazine or newspaper, with nearly half scanning QR codes from this source. Product packaging was the source of QR code scanning for 35.3 percent of the audience, while 27.4 percent scanned a code from a website on a PC and 23.5 percent scanned codes from a poster/flyer/kiosk.

comScore Chart 2
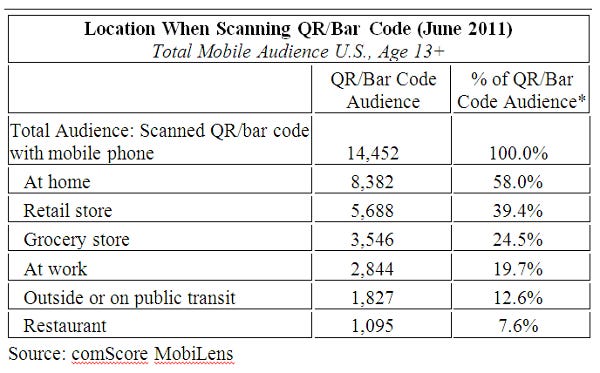
Among mobile users who scanned a QR or bar code on their mobile devices in June, 58.0 percent did so from their home, while 39.4 percent did so from a retail store and 24.5 percent did so from a grocery store. Nearly 20 percent scanned a QR code while at work, while 12.6 percent did so outside or on public transit and 7.6 percent did so while in a restaurant.

comScore Chart 3
Source: comScore Inc.
.
About the Author(s)
You May Also Like


